In this publication, the knowledge institute looks back on the developments in mobility between 2010 and 2021.
The total distance traveled by the Dutch by car, public transport, plane, bicycle or on foot was slightly higher in 2021 than in 2020. The distance covered by freight transport also increased slightly. This is stated in the Mobility Key Figures 2022 of the Knowledge Institute for Mobility Policy (KiM). In this publication, the knowledge institute looks back on the developments in mobility between 2010 and 2021. KiM also sketches a picture for the short and medium term based on 3 scenarios.
Developments up to and including 2021
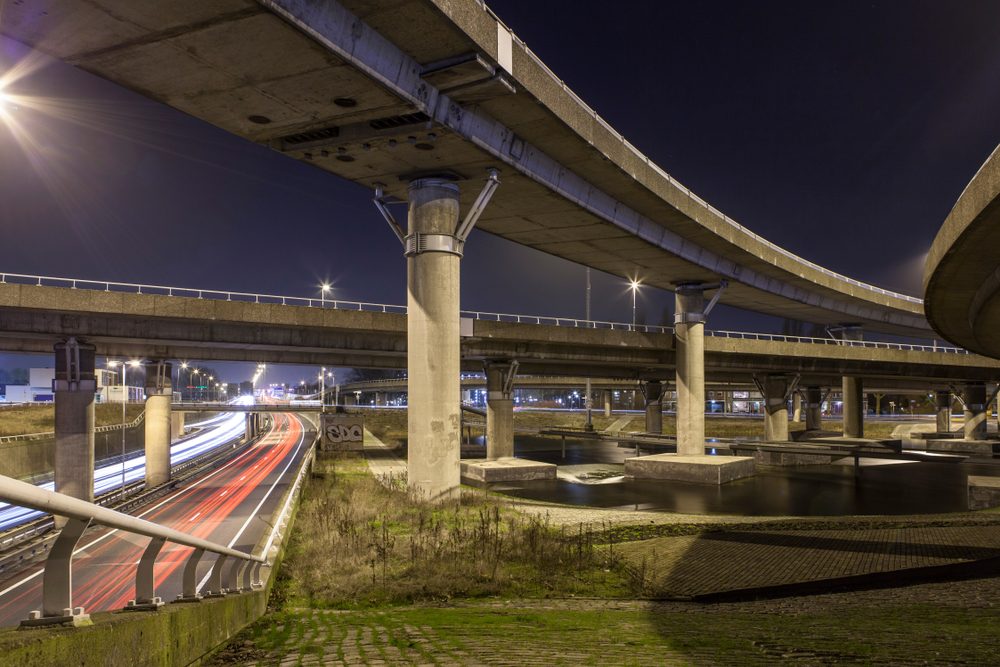
In 2021, passenger mobility was still clearly affected by the COVID pandemic. Although the distance traveled by people was slightly higher than in 2020, it was still clearly below the level of 2019, according to the Mobility Key Figures. Freight transport also increased slightly in 2021. Despite the COVID pandemic, the transport performance (in tonne-km) even slightly exceeded that of 2021 in 2019, despite the COVID pandemic. As a result of more passenger and freight transport, the volume of traffic and the loss of travel time on main roads in 2021 were (also) slightly higher than in 2020, but smaller than in 2019. The delay per train journey is decreasing.
Despite the slight increase in road mobility, the number of road deaths in 2021 was slightly lower than in 2020. A decrease has been visible since 2018. Emissions of nitrogen oxides (NOx) and particulate matter from combustion (PM10) by road traffic have also shown a downward trend for some time. CO2 emissions from road traffic have also fallen in recent years. The emission of particulate matter from tire wear (PM10 wear) keeps pace with the volume of road traffic.
Scenarios for the short and medium term
Due to the great uncertainty, KiM outlines 2027 scenarios for developments in the short and medium term (up to and including 3). These differ in environmental uncertainties (economic and demographic developments), temporary and structural corona effects and (potential) supply shortages, such as the scaling down of public transport and the shortage of parts for e-bikes. Assumptions that lead to less mobility growth are grouped in the less scenario and the assumptions that lead to more mobility growth in the more scenario. The base scenario is broadly in the middle.
Future road and bicycle traffic
For road traffic on main roads, KiM estimates a growth in the distance traveled in 2027 of 14% (basic scenario), 20% (more scenario) and 7% (less scenario) compared to 2019. To what extent this leads to more traffic jams, the KiM describes qualitatively. Traffic jams may be less strong on some days than before due to a better distribution of traffic over the hours of the day and the days of the week as a result of more working from home. The distance traveled by bicycle also shows growth in all scenarios, and in 2027 compared to 2019 will grow by 9% (basic scenario), 12% (more scenario) and 8% (less scenario).
Future public transport
According to KiM, train traffic will exceed the 2026 level in 2019 in the basic scenario. In the more scenario, this is in 2024. In the basic scenario, bus, tram and metro traffic (btm) will again exceed the level of 2024 in 2019 and in the more scenario in 2023. scenario, both train traffic and btm traffic in 2027 are still below the level of 2019.
Future aviation and freight transport
KiM limits itself to 1 scenario for the number of air passengers and freight transport performance. For 2027, KiM estimates a growth of 7% in the number of air passengers compared to 2019. This estimate is based on the adopted policy from the Climate and Energy Outlook 2022 (KEV2022) of the Netherlands Environmental Assessment Agency (PBL). It KiM has not yet taken into account a capacity restriction of 440.000 flights at Schiphol, an increase in aviation tax, the commissioning of Lelystad Airport and, for example, an increase in the blending obligation for sustainable fuels. For freight transport performance, a growth of 2027% is estimated for 8 compared to 2019.